
ORIGINAL DATA REPORT · HELLAMAID
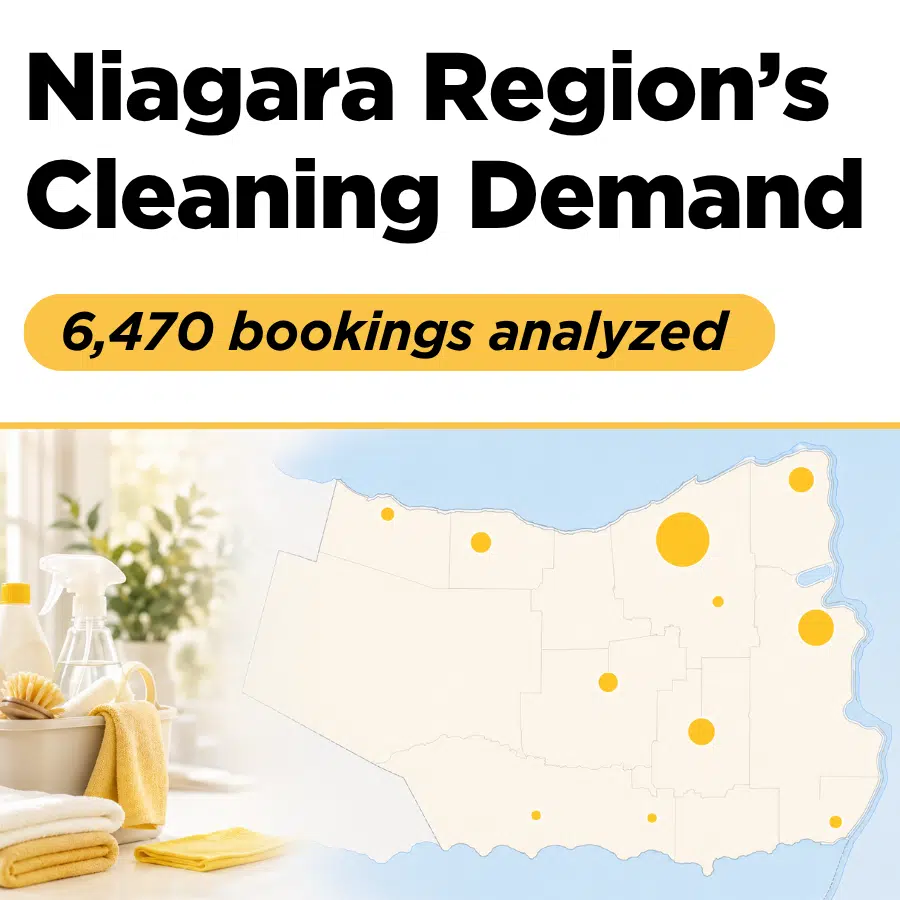
We’ve cleaned homes across the Niagara Region since 2017. This Niagara Region cleaning demand report looks at 6,470 completed residential bookings from December 2020 to August 2026, across all 12 municipalities, to answer a question nobody in this region has published data on: how does household cleaning demand actually differ from town to town?
It turns out the answer is sharper than we expected. Two municipalities twenty minutes apart can behave like completely different markets.
Of the 6,470 completed residential bookings analyzed, from Dec 2020 to Aug 2026, 6,442 could be confidently mapped to one of Niagara’s 12 municipalities. The remaining 28 bookings were excluded from municipality-level analysis rather than guessed at.
No pricing appears in this report. If you want to know what a clean costs, our rates are published on the Niagara Region house cleaning page.

Where cleaning gets booked in Niagara
| Municipality | Bookings | Share of region |
|---|---|---|
| St. Catharines | 2,519 | 39.1% |
| Niagara-on-the-Lake | 1,011 | 15.7% |
| Niagara Falls | 673 | 10.4% |
| Welland | 488 | 7.6% |
| Pelham | 455 | 7.1% |
| Lincoln | 397 | 6.2% |
| Grimsby | 379 | 5.9% |
| Thorold | 251 | 3.9% |
| Fort Erie | 221 | 3.4% |
| West Lincoln | 25 | 0.4% |
| Port Colborne | 17 | 0.3% |
| Wainfleet | 6 | 0.1% |
St. Catharines dominating isn’t surprising. It is the region’s largest city and our local base of operations. Niagara-on-the-Lake at 15.7% is the surprise. It has roughly a tenth of St. Catharines’ population but accounts for nearly a sixth of the region’s mapped cleaning bookings, which is the first sign that something other than population is driving demand here.
The recurring-versus-one-time split is the real story
This is the sharpest divide in the dataset, and it separates Niagara into two distinct cleaning markets.
| Municipality | Recurring share | One-time share |
|---|---|---|
| Pelham | 88.8% | 11.2% |
| Welland | 83.8% | 16.2% |
| Lincoln | 80.6% | 19.4% |
| Niagara-on-the-Lake | 79.9% | 20.1% |
| Grimsby | 79.4% | 20.6% |
| Fort Erie | 76.5% | 23.5% |
| St. Catharines | 69.6% | 30.4% |
| Niagara Falls | 57.9% | 42.1% |
| Thorold | 50.2% | 49.8% |
Pelham runs at 88.8% recurring. Thorold runs at 50.2%. Those are two fundamentally different businesses operating in the same region.
The high-recurring municipalities, including Pelham, Welland, Lincoln and Grimsby, behave like owner-occupied household markets. People set up a bi-weekly cleaning plan and keep it running for years. These are the most stable books of business in the region.
The lower-recurring municipalities tell a different story. Thorold sitting at almost exactly 50/50 fits a market shaped by student rental turnover around Brock University, where cleaning is often a transaction tied to a lease date rather than an ongoing household service. Niagara Falls at 57.9% reflects short-term rental turnovers, seasonal demand and move-out cleaning.
Niagara-on-the-Lake is the interesting exception. You might expect a tourism town to behave like Niagara Falls, but at 79.9% recurring it behaves more like a residential market. A vacation rental cleaned every week between guests is, mechanically, a recurring booking. It is tourism demand wearing residential clothing.
Seasonality: which parts of Niagara have a busy season
Using four complete years of bookings from 2022 to 2025, we indexed each municipality’s monthly volume against its own annual average. A reading of 100 means an average month.
| Month | St. Catharines | Niagara Falls | Niagara-on-the-Lake | Welland |
|---|---|---|---|---|
| January | 88 | 86 | 80 | 86 |
| February | 87 | 78 | 69 | 75 |
| March | 90 | 90 | 85 | 89 |
| April | 93 | 103 | 93 | 109 |
| May | 118 | 88 | 121 | 128 |
| June | 105 | 101 | 123 | 123 |
| July | 97 | 111 | 109 | 81 |
| August | 104 | 134 | 121 | 114 |
| September | 112 | 134 | 105 | 106 |
| October | 111 | 107 | 108 | 100 |
| November | 102 | 88 | 83 | 97 |
| December | 94 | 80 | 102 | 92 |

Niagara Falls swings hardest. August and September run 34% above its average month, while February sits 22% below. That is a 56-point spread, and it maps directly onto the tourist calendar.
Niagara-on-the-Lake peaks earlier and stays elevated longer. May through August all run 21% to 23% above average, consistent with wine-country and theatre season starting before the Falls’ peak summer traffic.
St. Catharines is the region’s steady market, moving in a much narrower band. Welland shows a spring surge in May at 128 that does not match either tourist pattern and looks more like seasonal deep-cleaning demand.
February is the quietest month almost everywhere in Niagara, and Niagara-on-the-Lake at 69 is the deepest trough in the entire dataset.
How long a clean actually takes
The median booking across every Niagara municipality is 3.0 hours. Duration scales with home size predictably:
| Home size | Average hours | Bookings |
|---|---|---|
| Studio / bachelor | 2.65 | 361 |
| 1 bedroom | 2.86 | 877 |
| 2 bedrooms | 3.03 | 1,062 |
| 3 bedrooms | 3.25 | 868 |
| 4 bedrooms | 3.59 | 302 |
| 5 bedrooms | 4.19 | 29 |
| 6 bedrooms | 4.07 | 22 |
Doubling the bedrooms does not double the time. Going from one bedroom to four adds only about 45 minutes on average, because kitchens and bathrooms, the two rooms that consume most of a clean, do not multiply with bedroom count.
By municipality, Fort Erie at 3.28 hours, Thorold at 3.21 hours and Lincoln at 3.19 hours run longest, reflecting larger properties on wider lots. Welland runs shortest at 2.82 hours, consistent with its high share of small recurring jobs. Two-cleaner teams cut all of these roughly in half.
What this means if you live in Niagara
If you’re in Pelham, Lincoln or Grimsby, you’re in a recurring-cleaning market. Availability is stable year-round and many households here book bi-weekly.
If you’re in Niagara Falls or Niagara-on-the-Lake, book ahead for summer. Demand runs a third above baseline from June through September, and short-term rental turnovers compete for the same weekend slots homeowners often want.
If you’re in Thorold or near Brock, move-out cleaning peaks with the academic calendar. April and August are the crunch periods.
If you’re in St. Catharines, you’re in the region’s steadiest market. Availability barely shifts across the year compared with the tourism-heavy municipalities.
Book a cleaning in Niagara Region
Hellamaid provides house cleaning across Niagara Region, including St. Catharines, Niagara Falls, Niagara-on-the-Lake, Welland, Pelham, Lincoln, Grimsby, Thorold, Fort Erie and nearby communities.
Book house cleaning across Niagara Region
If you are specifically looking for local service in our home city, you can also visit our St. Catharines house cleaning page.
Methodology and limitations
This report is based on 6,470 completed residential bookings with a non-zero price, from 20 December 2020 to 9 August 2026. Bookings were mapped to one of the 12 Niagara municipalities using the city entered at booking, with community names normalised to their parent municipality. Port Dalhousie and Merritton were mapped to St. Catharines, Virgil and Queenston to Niagara-on-the-Lake, Fonthill to Pelham, Beamsville and Vineland to Lincoln, Crystal Beach and Ridgeway to Fort Erie, and so on.
In total, 28 bookings could not be confidently mapped and were excluded rather than guessed at. Commercial contracts were separated out and are excluded from every figure above.
Limitations worth stating plainly:
- About 44% of bookings have no recorded bedroom count, mostly hourly bookings. The duration-by-size table describes package bookings only.
- Duration is scheduled booking time, not clocked time on site.
- West Lincoln, Port Colborne and Wainfleet have too little volume for meaningful analysis. Their counts are shown, but no conclusions are drawn from them.
- Seasonality uses 2022 to 2025 complete years only. 2026 is partial, through 9 August.
- This is one company’s booking data. It describes Hellamaid customers in Niagara, not the regional market as a whole.
- No customer names, addresses or contact details were used at any stage. Geography was handled at city level only.
Journalists, researchers or local operators who want a specific cut of this data are welcome to get in touch. We’re happy to share it.
About Hellamaid in Niagara
Hellamaid has served the Niagara Region since 2017 from our office at 108 Geneva St in St. Catharines, covering all 12 municipalities. Every cleaner is background-checked and covered under $5M liability insurance, and we’re certified by the Ontario Living Wage Network.
House cleaning across Niagara Region · Cleaning services in St. Catharines